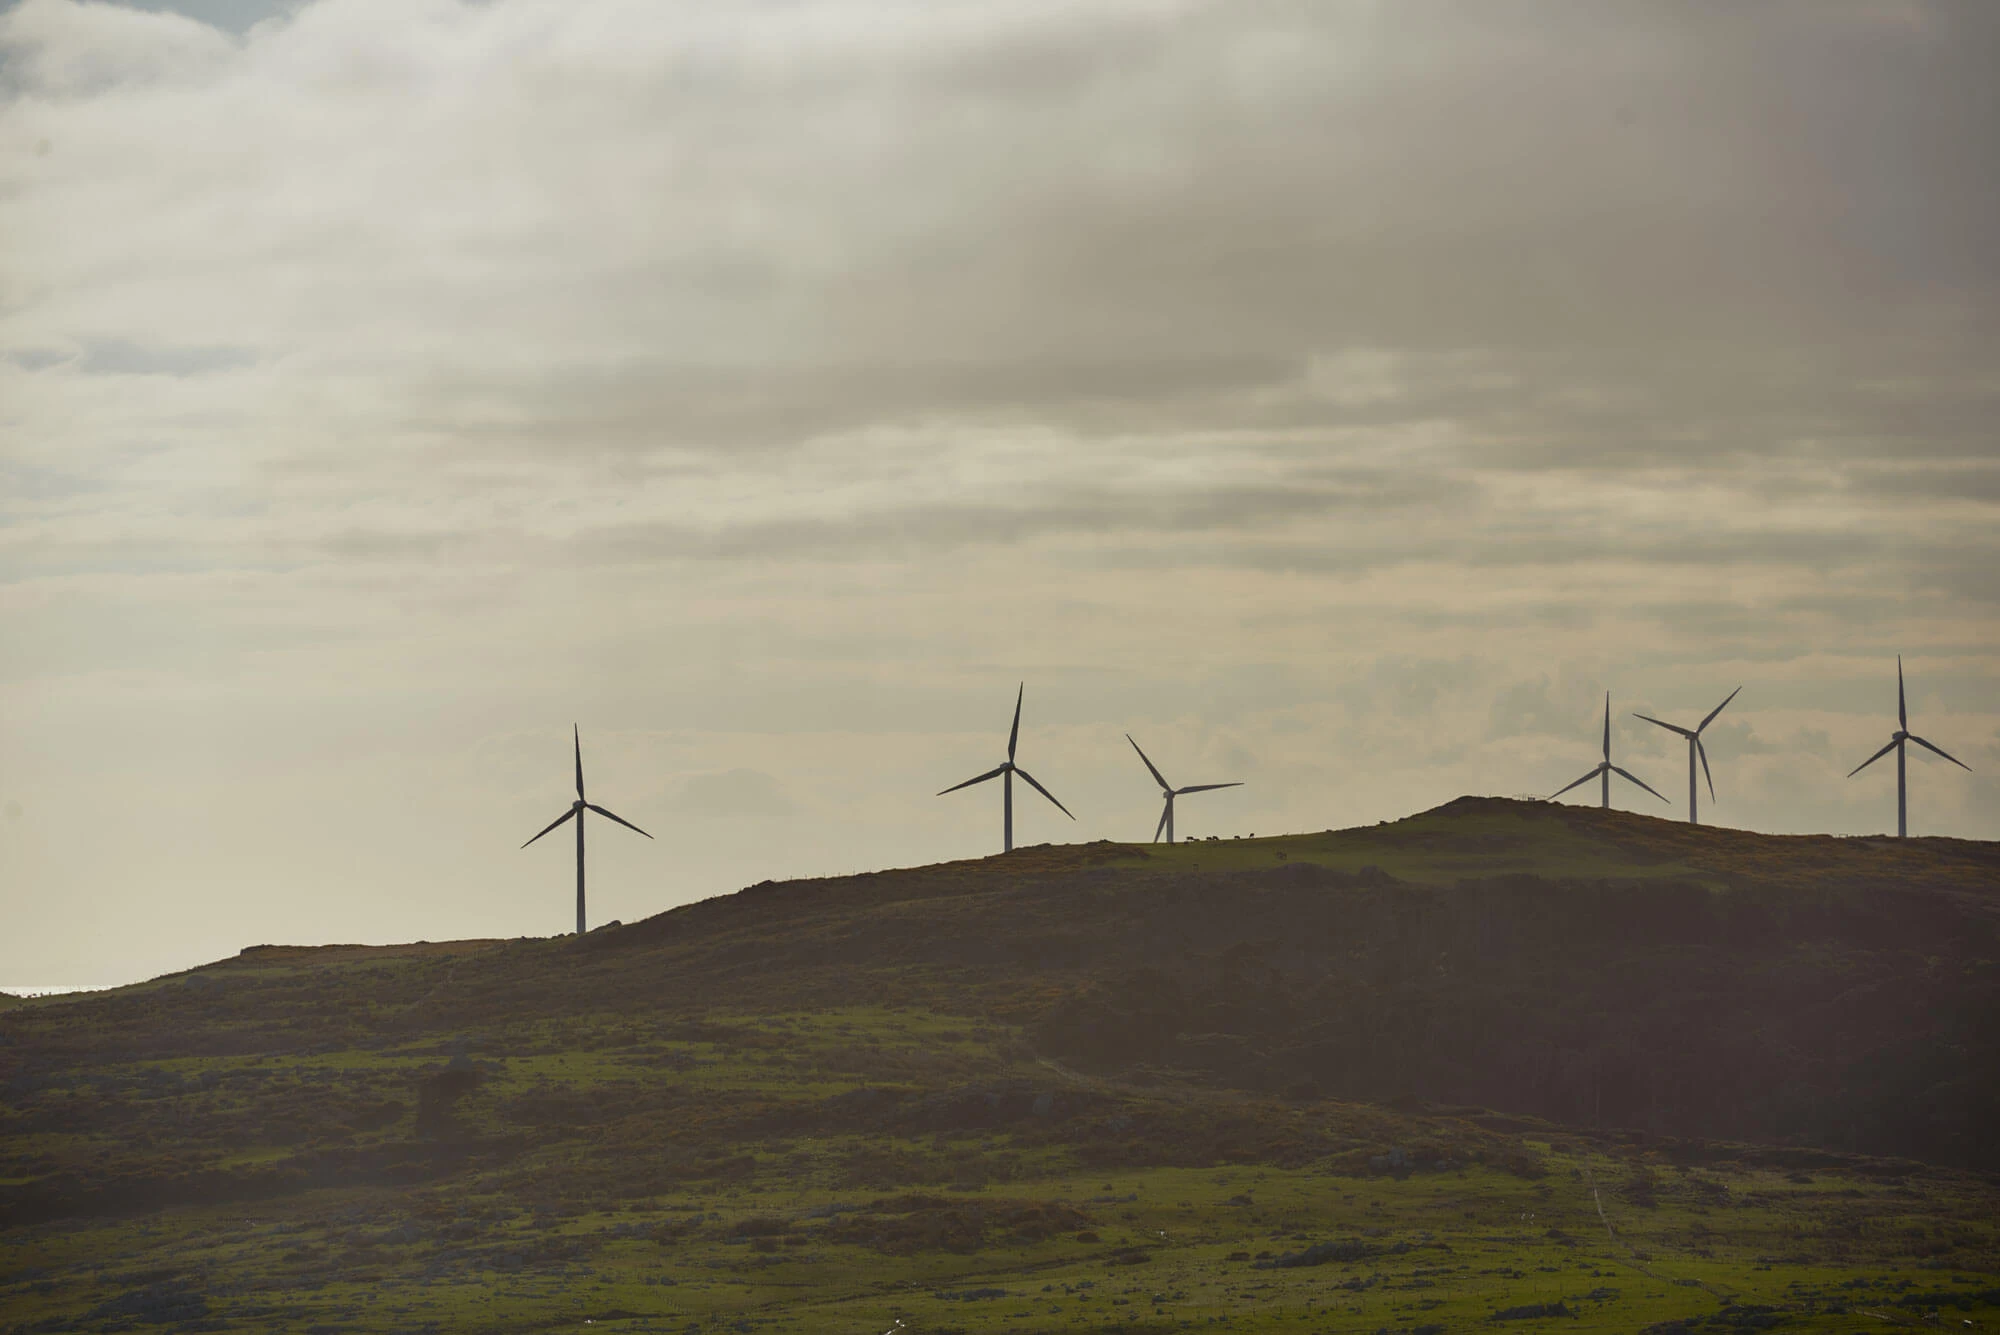
Understanding Wind Speed
Wind speed describes how fast the wind is moving and is measured in metres per second (m/s). It strongly influences how much electricity a wind turbine can produce.
How wind turbines respond to wind speed
- 3–5 m/s – Turbines start generating electricity (cut‑in speed).
- 10–15 m/s – Turbines operate at maximum output.
- ~25 m/s – Turbines shut down for safety (cut‑out speed).
Because wind varies constantly, turbines do not run at full power all the time. In real‑world conditions, only 10–40% of the wind’s energy is typically converted into electricity.
What is a good wind speed?
- < 5 m/s – Generally unsuitable for wind energy
- 6 – 7 m/s – Moderate, may suit small or specialised projects
- 7 – 8.5 m/s – Good for modern wind turbines
- > 8.5 m/s – Excellent wind energy conditions
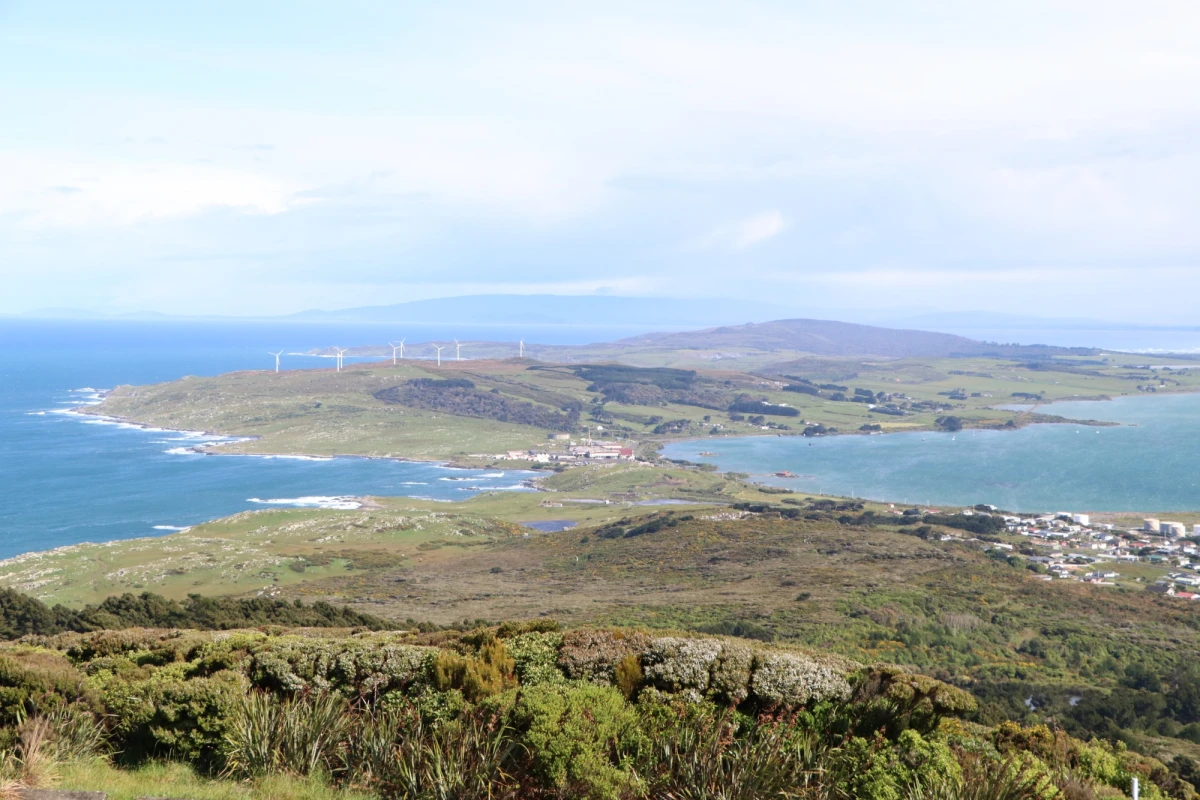
In practice, many operating wind farms and recent wind energy investments in Southland and across New Zealand typically target areas with long-term average wind speeds of approximately 9-11 m/s.
Wind Classes
Wind turbines are designed for different wind conditions, defined by International Electrotechnical Commission (IEC) standards:
- IEC III (Low wind): 7.5 m/s
- IEC II (Medium wind): 8.5 m/s
- IEC I (High wind): 10 m/s
Higher classes indicate stronger and more productive wind environments.
Understanding Wind Power Density
It combines wind speed, frequency, and air density into a single value and is measured in watts per square metre (W/m²). This makes it one of the best indicators of wind energy potential, often more informative than wind speed alone.
| Power Density (W/m²) |
Resource Quality |
| 0–200 |
Very poor |
| 200–300 |
Poor |
| 300–400 |
Marginal |
| 400–500 |
Good |
| 500–600 |
Very good |
| 600–800 |
Excellent |
| > 800 |
Outstanding |
Contact
This map is part of the Energy in the Landscape programme led by Great South, and the wind data is sourced from the Global Wind Atlas.
For more information, please visit our website Net Zero & Decarbonisation
For site-specific inquiries or further assistance, please contact: info@greatsouth.nz